Background
In the world of software testing, Performance Testing can mean different things to various teams and individuals, depending on what they are testing. For example, Load Testing and Stress Testing using tools like JMeter or SoapUI are more commonly associated with Performance Testing to validate an application’s backend server when multiple users interact with the application simultaneously.
However, Performance Testing for iOS or Android Mobile Web and Native Applications is an area that not many organizations have explored, partly because few market tools provide a decent Performance Testing solution for mobile devices.
Organizations with customer-facing applications have prioritized Automation Testing for mobile over the last few years. However, as applications grow, so does the demand from customers for applications that work optimally with no interruptions. For example, suppose a user downloads an application from the AppStore and experiences issues such as slow loading or crashes. In that case, they will likely switch to another application that meets their needs.
While traditional Automation Scripts focus heavily on the functional aspect of the application, they fail to validate other critical elements of the application’s performance. For example, they do not validate the time taken to navigate around and land on a new page, spikes in CPU, memory, and battery usage, or any unnecessary network calls made during user flows. These are daily challenges that users face, yet organizations fail to emphasize testing these areas of mobile applications.
How does Digital.ai Approach Challenge?
The true value of Performance Testing on Mobile is measurable when you can run a large number of Performance Tests across various Device Models and OS Versions.
Testing Performance for a single device may not accurately reflect what users actually face, but using trends and understanding how a single transaction behaved across a range of Device Models and OS Versions will paint a better picture.
But how do you scale Performance Testing on Mobile to measure such data?
Digital.ai introduces commands that can be implemented within a Functional Appium Script; this means we can combine a Functional Automation Script with Performance Testing.
If we look at a simplified Functional Appium Script for a scenario where we are testing the Login functionality of an application, we can see that the test is straightforward. First, we populate the username and password field, clicking on the Login button until we finally land on the next page:

If we were to implement Performance Testing into this Functional Appium Script, it would look something like this:
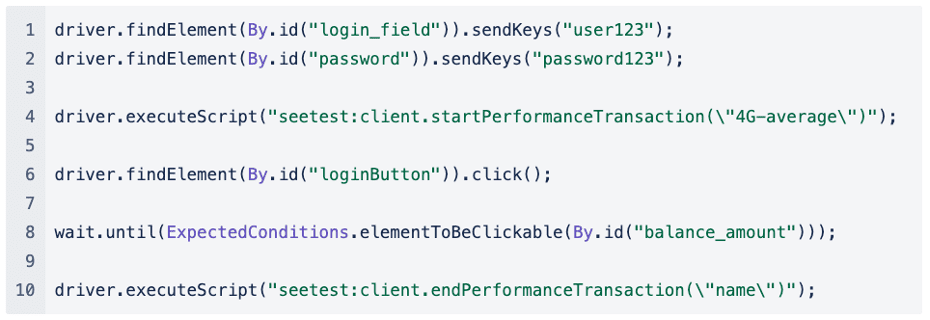
Before the Script clicks on the Login Button, we start a Performance Transaction, and as soon as we have landed on the next page, we end the Performance Transaction.
Capturing the Performance Transaction for populating the username and password field is less important since entering the text from an Automation Script may not accurately represent how long it actually takes the user to enter their credentials.
We can measure how long it took to navigate from the Login page to the next page or if there were any spikes in the CPU, Memory, or Battery consumption when we click on the Login button.
We also can simulate a different network condition to see how the end-user experiences the application when they are under different network conditions, and the Network Profile is passed as the first parameter:
driver.executeScript(“seetest:client.startPerformanceTransaction(\”4G-average\”)”);
Let’s look at the type of metrics we capture and how they can help us understand how the Performance Transaction went.
What Types of Metrics Are Being Captured as Part of a Performance Transaction?
For each Performance Transaction, we capture the following metrics:
- Duration: Duration of the entire transaction, from start to end
- Speed Index: Computed overall score of how quickly the final content was painted
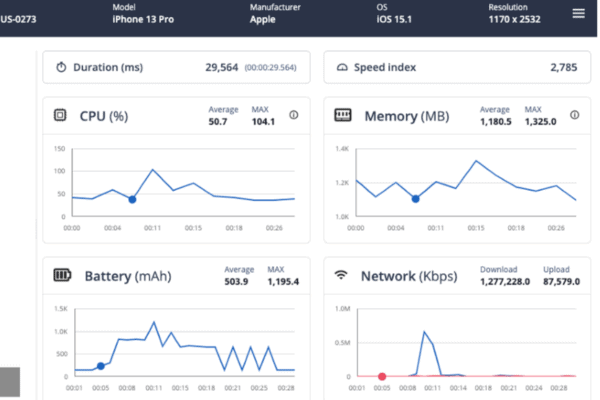
- CPU: Graph with the consumed CPU, average and maximum values for the transaction
- Memory: Graph with the consumed Memory, average and maximum values for the transaction
- Battery: Graph with the consumed Battery, average and maximum values for the transaction
- Network: Total of Uploaded/Downloaded KBs during the transaction based on the Network Profile applied
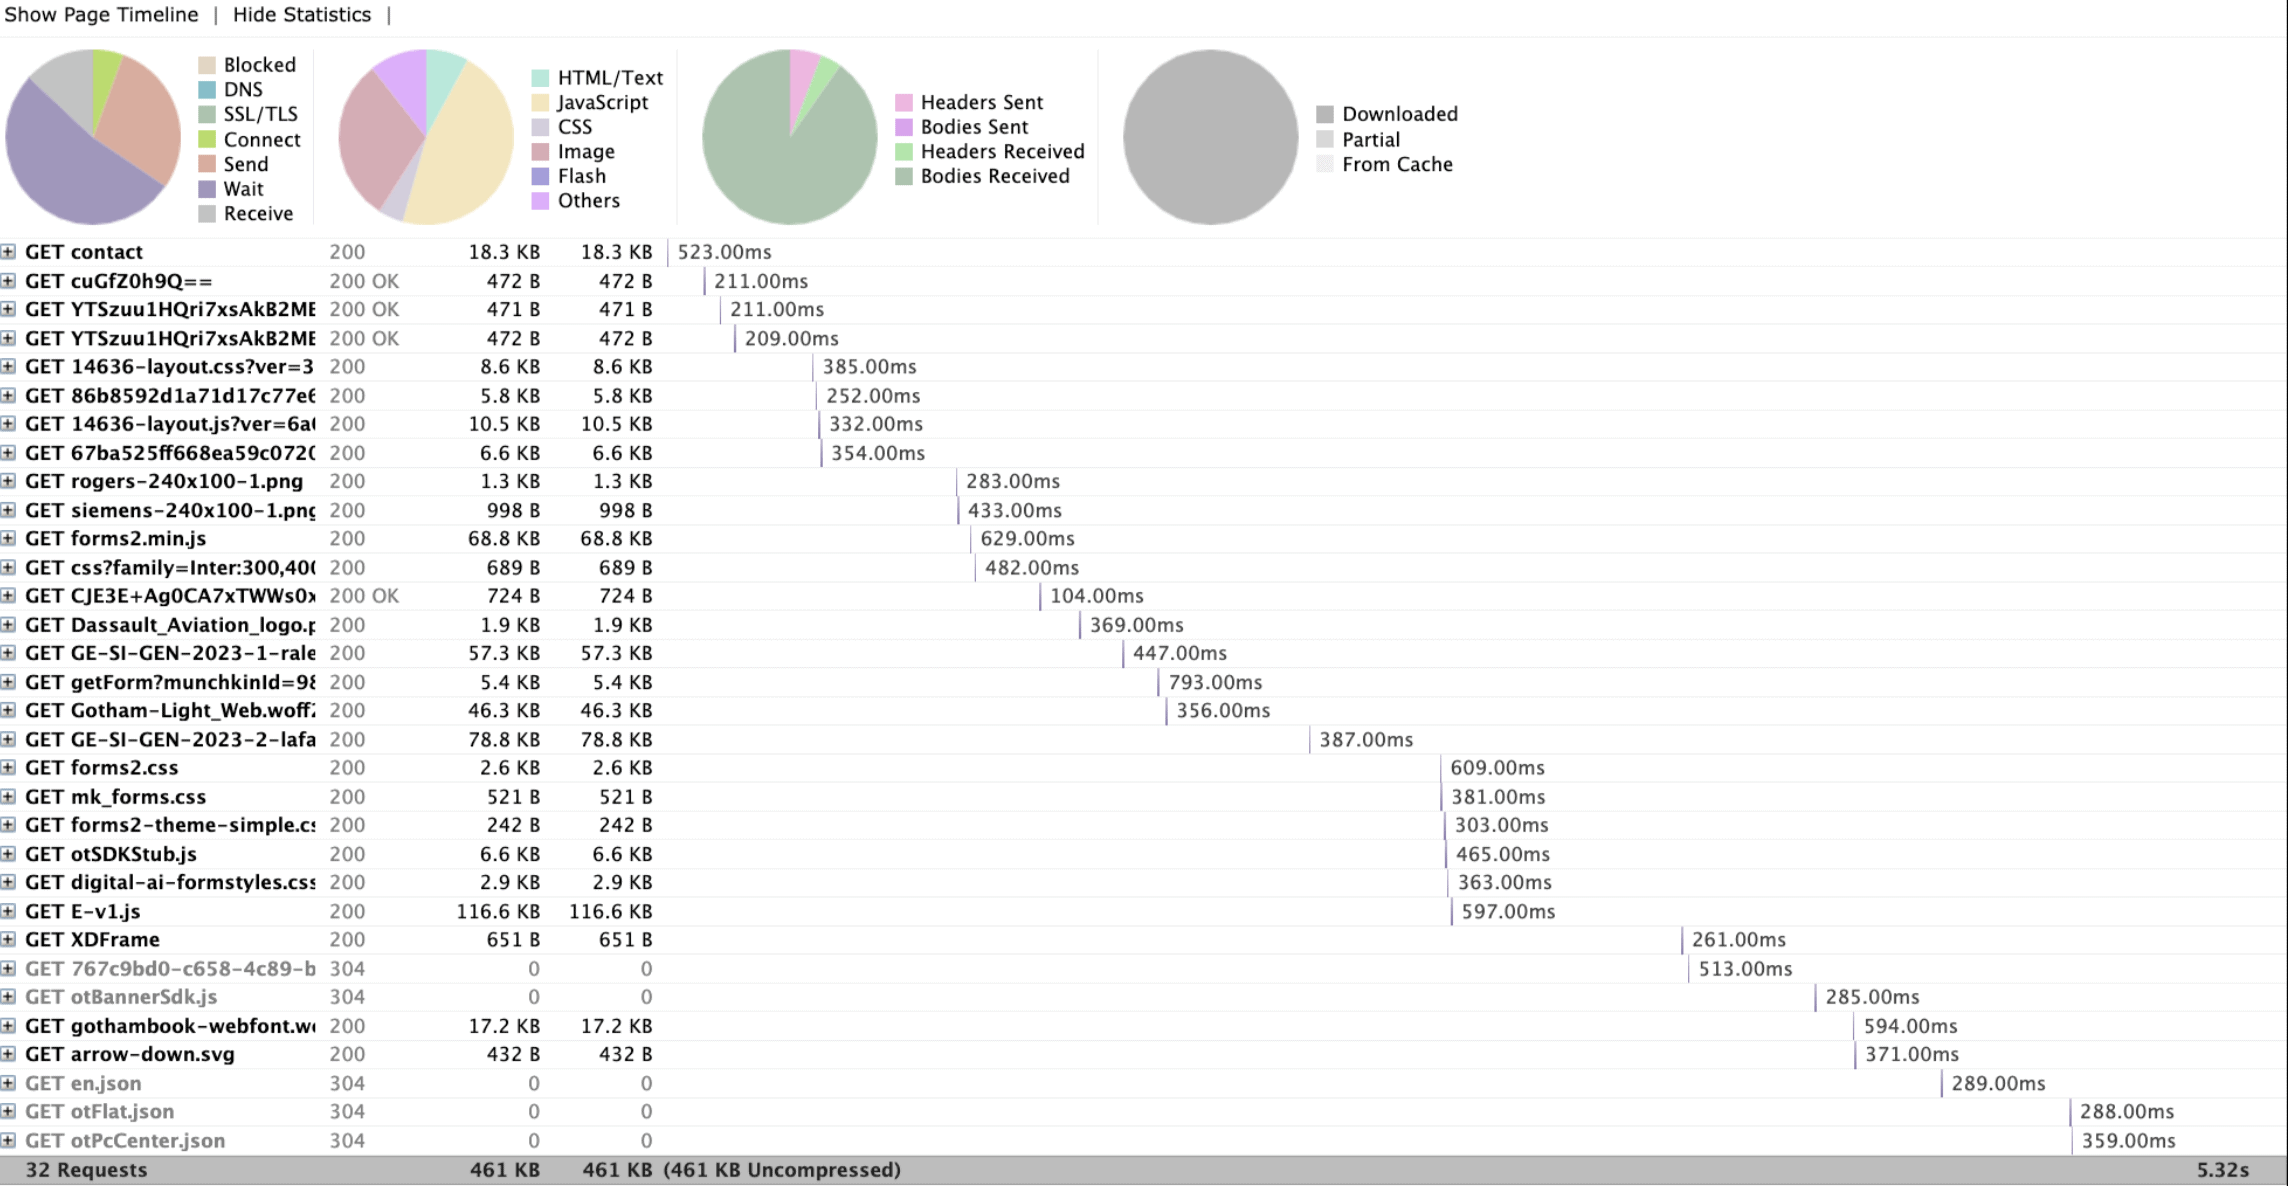
- Network Calls: All the network calls made during the transaction
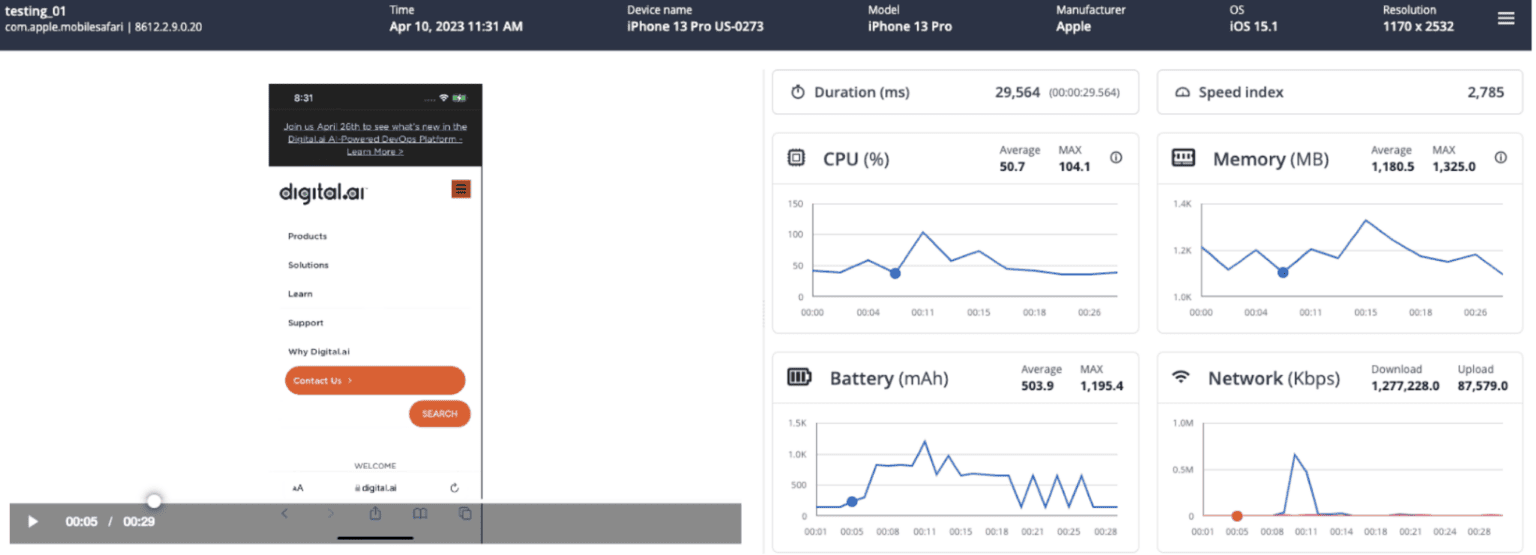
What we are looking at is a single Performance Transaction that ran on an iPhone 13 Pro. We can play back the Video that was captured as part of the Performance Transaction and in relation to the video, we can follow along with the CPU, Memory, and Battery consumption.
How Does This Report Help Me Understand Trends and Potential Bottlenecks?
The report we just looked at focuses on an individual Performance Transaction. But imagine if we have now run the same Performance Transaction at scale across many device models & OS versions, we can leverage our built-in reporting capabilities to start looking at trends.
Here is an example report which is filtered to show all the Transactions I’ve run under a specific build and a particular Transaction (e.g., Searching for an item from the search field in a native application and understanding how long it took to load the next page in the context of a retail application):
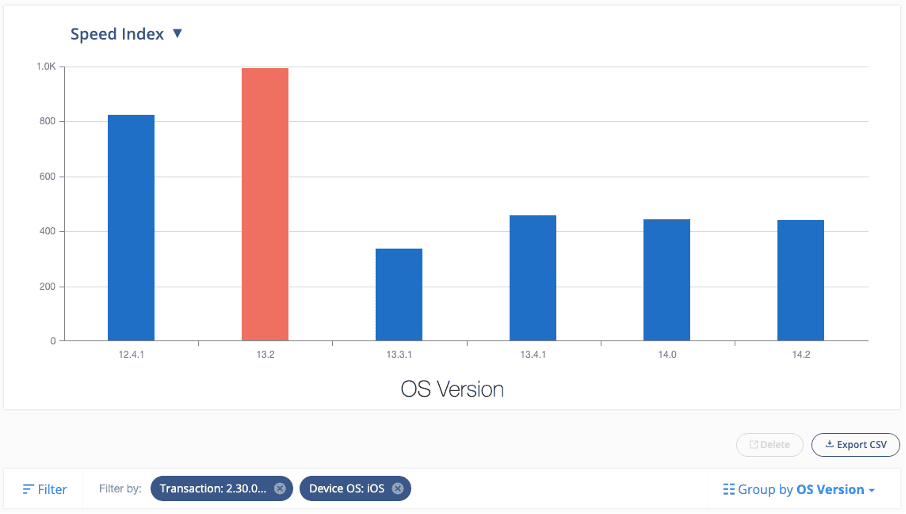
This report tells me that Speed Index was significantly higher on iOS Version 13.2 compared to other iOS Versions.
Similarly, we can look at trends for the other metrics as well, such as CPU, Memory, and Battery:
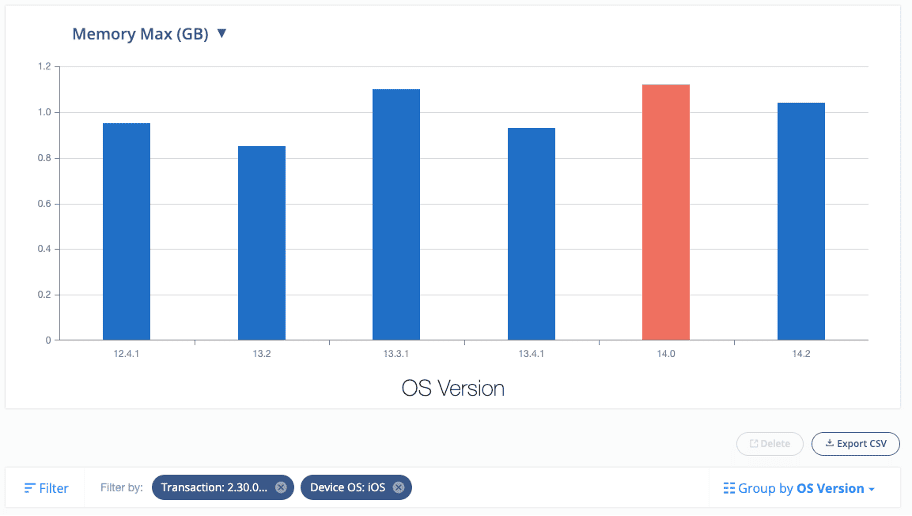
This level of information enables QA testers and developers to investigate specific Device Models and OS Versions for potential bottlenecks and identify areas for improvement in the mobile application being tested.
It’s important to note that there may be performance differences between different devices or networks. It’s common to see up to a 30% variance between devices, which doesn’t necessarily indicate a severe performance issue. However, performance problems can cause differences of 10-100 times the baseline measurements.
Do I Need to Implement Performance Testing Into Existing Functional Automation Scripts?
Whether it makes sense to implement Performance Testing into existing Functional Scripts or to create new standalone Scripts for Performance Testing will depend on the flexibility and complexity of the current Automation Framework.
In the example I gave earlier, the code is oversimplified. Still, let’s think about the same approach in the context of an existing Automation Framework. Many more dependencies and layers may be involved when calling on a method to perform operations such as Click or Send Keys.
Let’s look at an example:
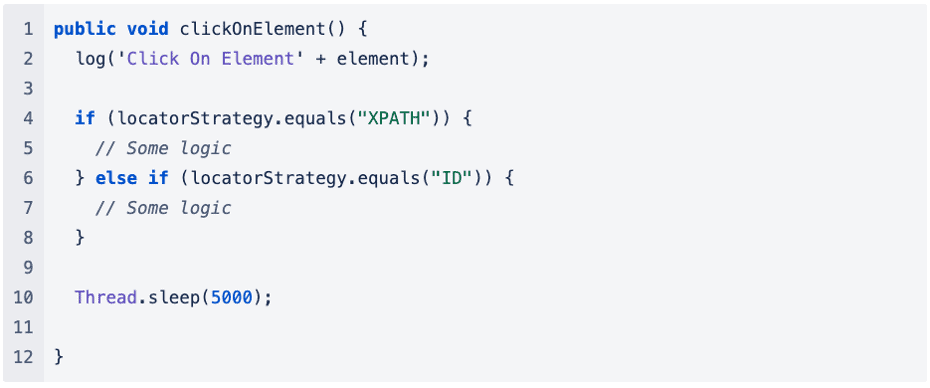
Adding more logic to the existing automation framework could increase the overall time required to run the automated script, which may negatively impact the performance tests and not provide valuable metrics.
If the complexity of the existing automation framework hinders Performance Testing, writing separate automation scripts exclusively for capturing performance metrics is recommended.
This allows us to simplify the code logic to a certain degree, enabling us to capture the appropriate metrics for the Performance Tests accurately.
What Type of Benchmark Numbers Should I Set to Ensure the Data Captured is Measurable?
There are no universal or standardized metrics to apply when measuring performance, as each organization and its teams define the user experience for their own application. In addition, depending on the complexity of the application, the benchmark numbers may vary from page to page or application to application.
An example of a metric that can be used is TTI (time-to-interactivity), which measures how long it takes for an application to become usable after the user has launched it.
There has been research done on that, and some helpful rules of thumb based on HCI (Human-Computer Interaction) research tells us:
- Any delay over 500ms becomes a “cognitive” event, meaning the user knows that time has passed.
- Any delay over 3s becomes a “reflective” event, meaning the user has time to reflect on the fact that time has passed. They can become distracted or choose to do something else.
But there are other metrics as well that are considered Key Performance metrics, such as:
- Highest Response Time
- Average Response Time
- Maximum number of Requests
If your server’s response time is slow, it can hurt the user experience. Google PageSpeed Insights recommends a server response time of under 200 ms. A 300-500 ms range is considered standard, while anything over 500 ms is below an acceptable standard.
It’s important to note that there’s no one-size-fits-all answer for these metrics, and determining the baseline can vary from case to case. Therefore, it’s crucial to understand what’s acceptable within the context of the application being tested. This may involve collaborating with the Application Developers to gain insight into the application’s backend, such as the number of network calls made during a particular user flow, heavy operations happening in the backend when interacting with certain application components, and other related factors.
It can also be helpful to run a handful of Performance Tests to then use as a baseline.
Should I Run My Performance Tests on All Available Device Combinations?
When deciding which devices to test for Performance Tests, it is important to consider the ones that generate the most revenue. Determining this requires a clear understanding of the user base and the types of devices used most frequently for the Application being tested.
From there, it’s recommended to select the top 5-10 devices to test against consistently (the exact number may vary depending on the scale of the project and user base). This approach helps establish a baseline for the tested devices, enabling more accurate performance measurements.
Summary
Performance Testing is critical to ensure that software, applications, and systems can handle expected loads and traffic. It helps identify and address performance bottlenecks and potential failures before deployment, ensuring end-users have a seamless experience.
In contrast to traditional Automation Scripts, Performance Testing aims to measure the time a user takes to navigate between pages, identify any spikes in CPU, Memory, and Battery consumption, and pinpoint unnecessary Network Calls.
The value of Performance Testing lies in the ability to identify issues early in the development process, reducing the costs associated with fixing them later. Moreover, it helps to establish a baseline for performance metrics that can be monitored and compared over time, providing insights into how changes in the system impact performance. Performance Testing is essential to any software development cycle, from development to deployment and beyond.
Ready to start performance testing for mobile? Contact us today at https://digital.ai/why-digital-ai/contact/
Are you ready to scale your enterprise?
Explore
What's New In The World of Digital.ai
How Continuous Testing Fosters Dev and Security Collaboration: The Fashionable Approach to Secure Development
Discover how continuous testing and app sec foster a collaborative SDLC, creating a complex labyrinth for attackers while empowering teams and reducing costs.
BPCE Banking Group Streamlines Quality Assurance and Delivery Process with Digital.ai Continuous Testing
Explore how BPCE Banking Group revolutionized testing with Digital.ai Continuous Testing, driving efficiency and quality in banking innovation.
The Bias in the Machine: Training Data Biases and Their Impact on AI Code Assistants’ Generated Code
Explore biases in AI training data impacting code generation and learn strategies to mitigate them for fairer AI development and software innovation.
